

Pipeline is up in January. The board is pleased, and it feels like the hard work is finally paying off. Then March arrives and the number drops sharply.
The drop itself isn't the biggest problem. The bigger problem is that nobody knows why it happened, where the strong quarter came from, or how to repeat it. That's what predictable pipeline solves. It's not about generating more pipeline, but about generating pipeline your leadership team can trust rather than estimate.
This blog was created from episode 141 of Demand Decoded, “The Predictable Pipeline Playbook: From Lucky Quarters to Repeatable Growth”.
What predictable pipeline actually means
When businesses say they have predictable pipeline, they often mean they've hit their number once. That isn't predictability. It's a good result that may or may not happen again.
Predictable pipeline is made up of three parts:
-
A number: what you expect to happen, for example, 1 million in pipeline every month
-
A range: how far you can deviate from that forecast, for example, 15% either side
-
A track record: how consistently you land within that range over time
With a 1 million forecast and a 15% tolerance, missing by 10% still counts as predictable. Track that over 12 months and you'll soon see whether your number is something you can plan around.
Beating your forecast can also count as a miss. If you exceed it by 50% with a 10% tolerance window, it shows you don't fully understand what's driving your pipeline.
It's a welcome miss, but a miss all the same. Knowing why it happened helps you forecast more accurately next time.
Why predictability matters more than the total
Take two companies that each generate roughly 1 million in pipeline a quarter across a year. One delivers a steady 1 million every quarter. The other produces 1.4 million in Q1, 600k in Q2, 200k in Q3, and 2.1 million in Q4.
The annual totals are similar. But only one of them can plan with any confidence.
Predictability lets you plan hiring, ad spend, and sales targets. It also gives you a stable foundation for strategic bets. If you can prove where most of next year's pipeline will come from, you can test new channels on top of that base.
Step 1: Get your CRM data in order
Before you can rely on a pipeline number, your CRM needs to reflect reality. That means addressing four areas.
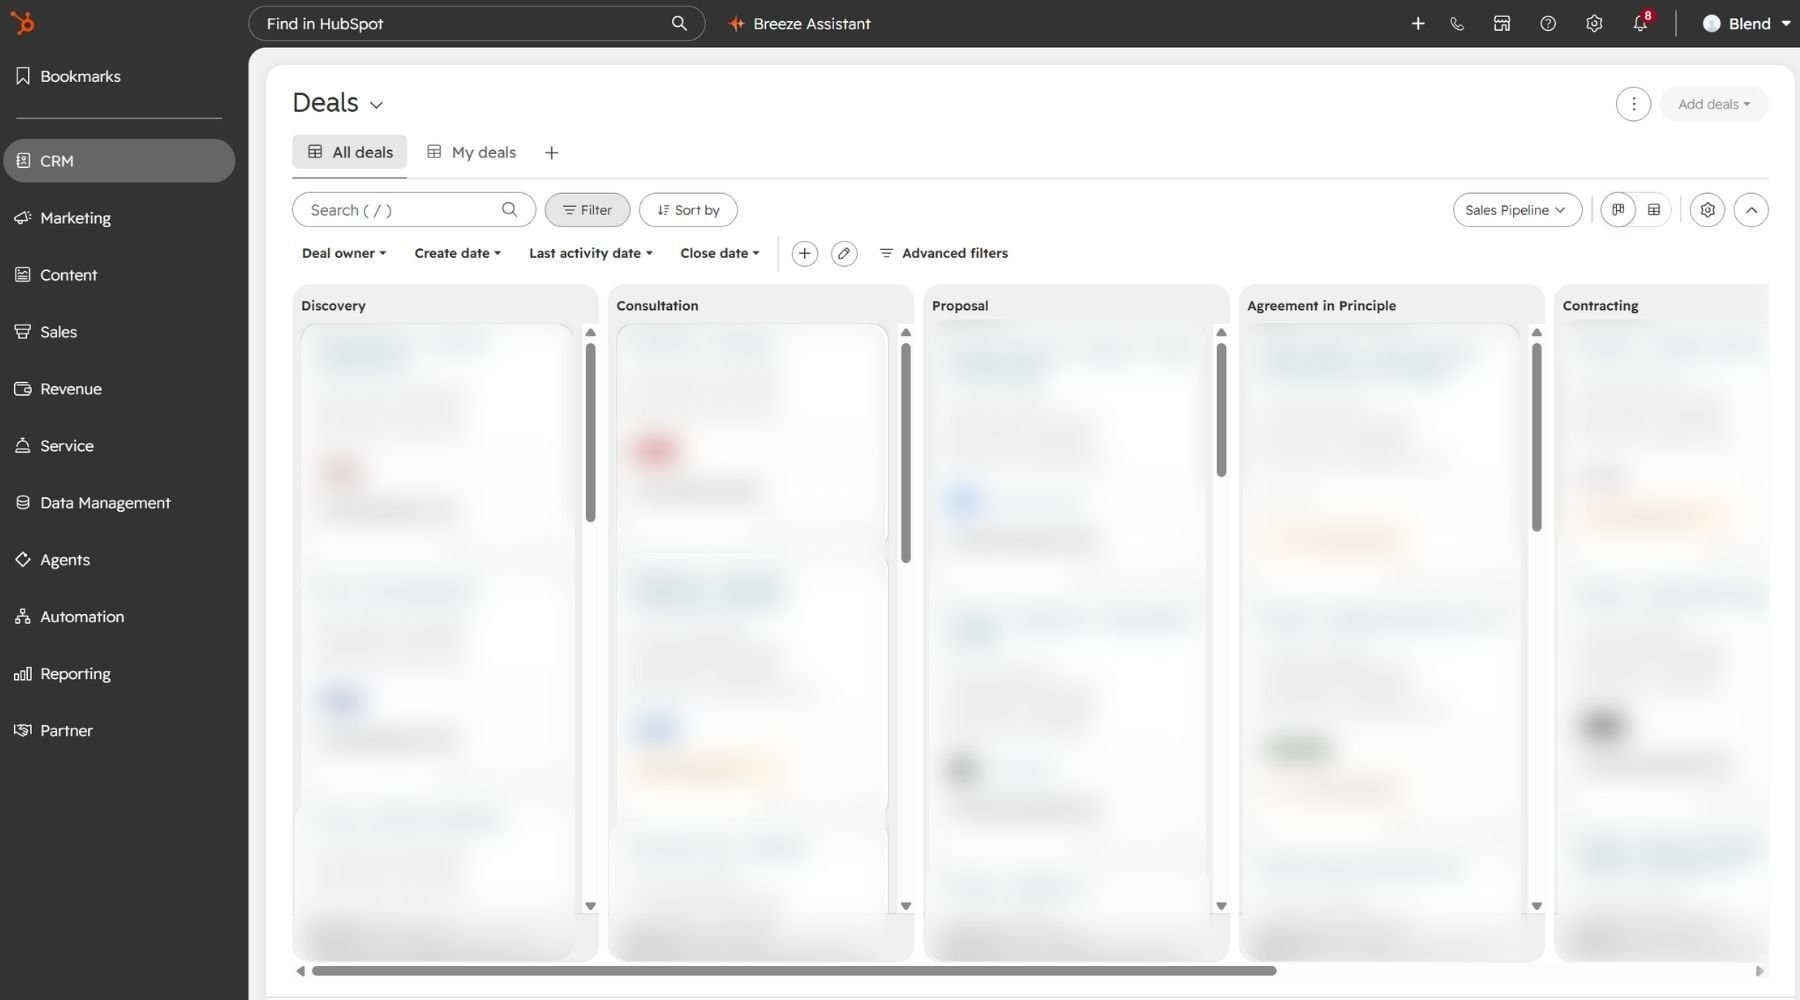
Consistent pipeline stages
Picture three reps using the same pipeline:
-
One doesn't create deals until contracting
-
Another waits until proposal
-
A third follows the process from discovery onwards
That data isn't comparable, so you can't weight it or predict from it. The deals in your pipeline should reflect the active deals in your business right now.
Accurate close dates
Close dates that move back by a month, every month, undermine any forecast. Either update them with a clear reason for the change, or mark the deal as closed lost and create a new one if the buyer re-engages.
Reps can be reluctant to do this because it reduces their pipeline number. But if a close date has moved three or four times, it's usually a sign the deal should be closed out. The longer a deal lingers, the less likely it is to close.
Known sources
If you have a strong quarter and nobody knows where the pipeline came from, you can't predict how much will close. You can't recreate it either.
Large deals separated out
A few enterprise deals landing in one quarter can look like a breakthrough. If you remove them and your underlying pipeline hasn't changed, your baseline hasn't improved. Predictability is about your standard run rate, not one-off wins.
Can you answer these four questions?
Once your data is in shape, you should be able to answer:
- What did you forecast last quarter, and what did you actually achieve?
- Where did your pipeline come from, by source?
- How many deals moved stage in the last 30 days?
- What's the conversion rate of each source into closed won?
If you can answer all four, you're ready to build a reliable view of your pipeline and how much of it is likely to close.
Step 2: Break your pipeline down into 3 layers
Even if your pipeline is predictable, you still need to know where it comes from. Three layers let you take a high-level view for leadership conversations, then go into detail when you need to optimise.
| Layer | What it shows | Examples |
|---|---|---|
|
1. Pipeline source |
A high-level view of how deals are sourced |
Outbound, partner-driven, website inquiry, events, customer expansion |
|
2. Source detail |
A more detailed view of each source |
Self-reported attribution, the specific event, the referring partner, the signal that triggered outbound |
|
3. Channel detail |
Where each channel performs best |
High-value Google keywords, best-converting LinkedIn ads, top-referring partner teams |
Layer 1: Pipeline source
These should be broad categories. They're ideal for senior conversations, and they encourage you to look beyond marketing's own channels. Paid search might be your strongest marketing channel, but it's only one of many ways pipeline reaches your business.
The insights here can shape your wider strategy:
-
If outbound is your largest source, consider how to support it further, whether that's more reps or better infrastructure to help them convert.
-
If partners bring in a high volume of deals, look at whether you have partner marketing initiatives in place to grow those relationships.
-
If events take a large share of budget but produce little pipeline, it may be time to change your approach or run fewer of them.
Layer 2: Source detail
This layer measures each source in the way that suits it best.
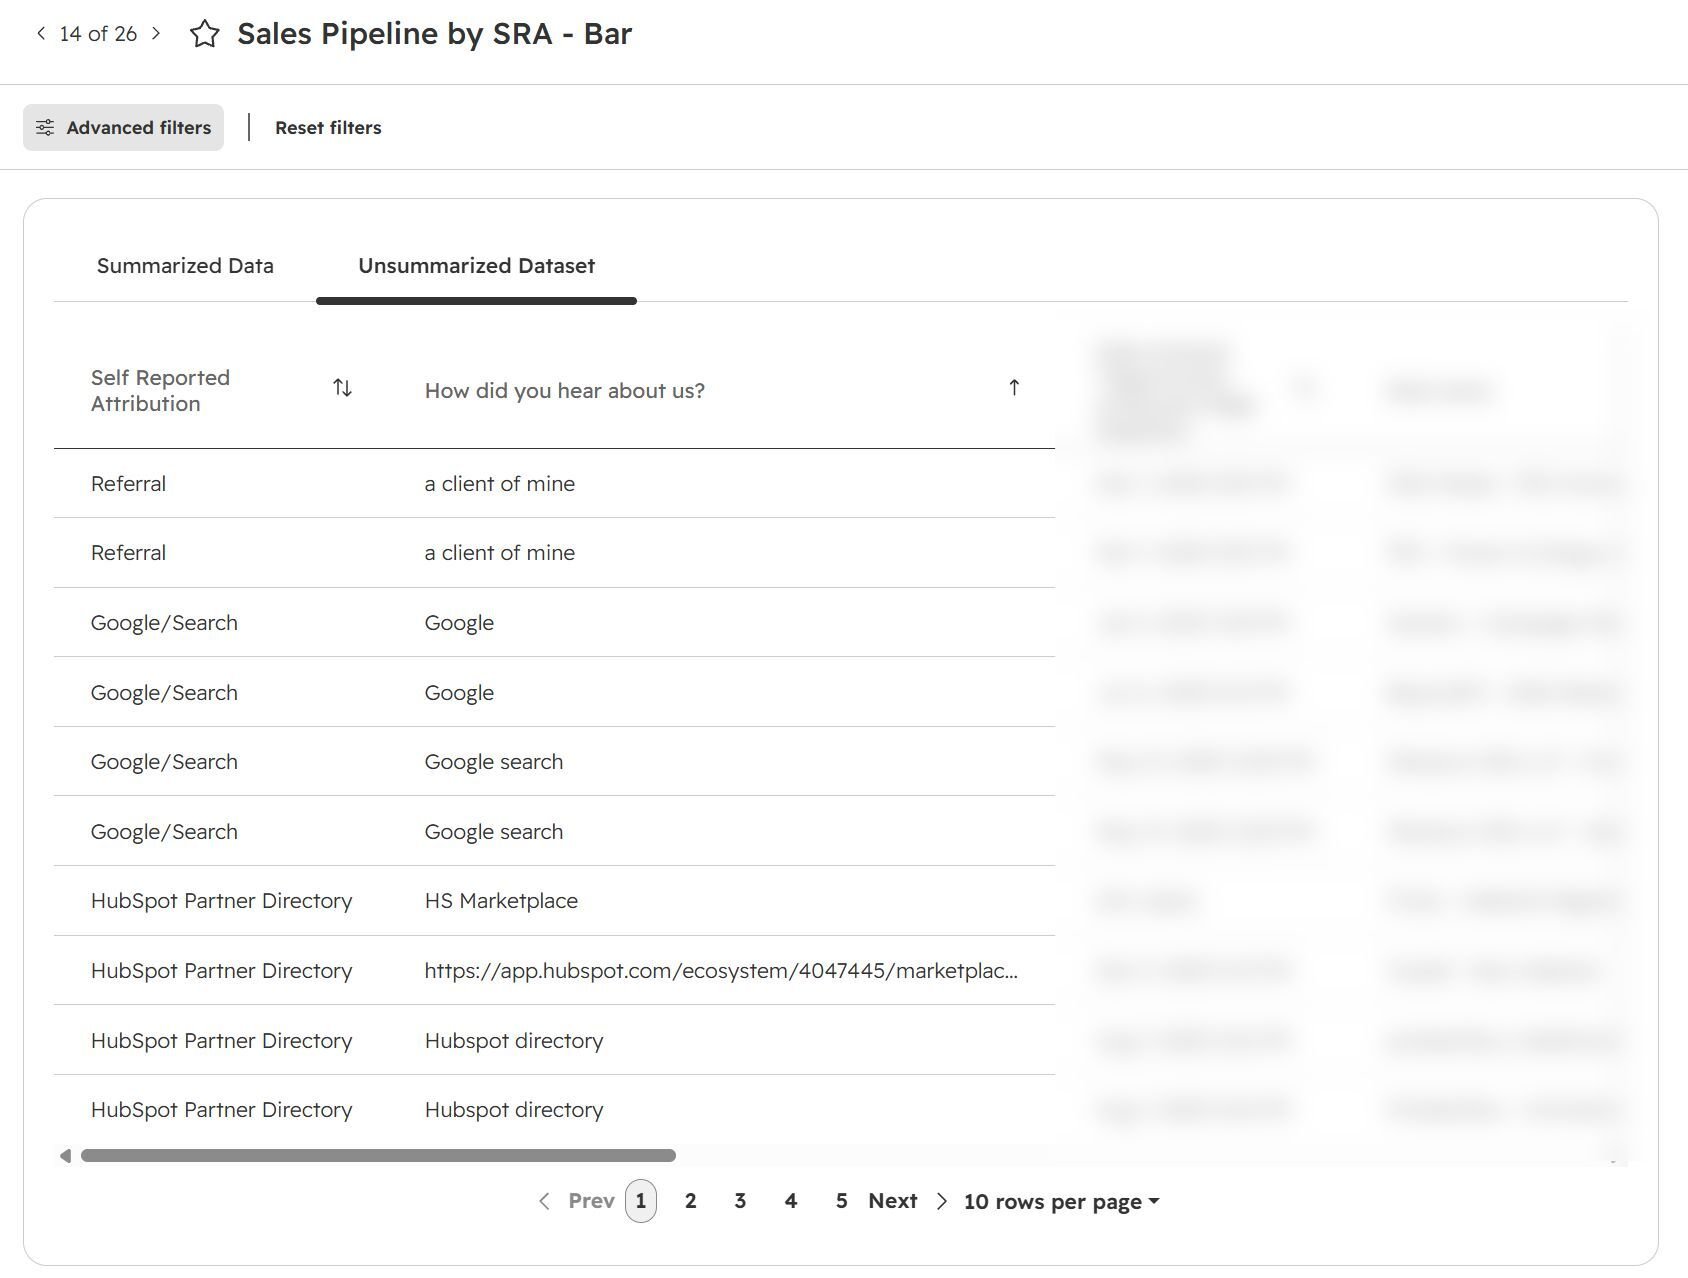
For website inquiries, self-reported attribution is essential. A simple "How did you hear about us?" field on your high-intent forms shows what the buyer considers the most influential part of their journey.
Combine this with software attribution, which shows the last-touch channel that brought them to your site, and you get a much fuller picture. Self-reported attribution reveals the dark channels software can't track, including:
-
Podcasts
-
Communities
-
Word of mouth and peer recommendations
-
AI Overviews and ChatGPT
For events, it means seeing exactly which events produced pipeline. Whether you track this in a property or an object doesn't matter, as long as the data is accessible. You can also break sources down by country or industry to spot trends.
Layer 3: Channel detail
This layer shows where a channel has the greatest impact and how to optimise it. For example:
-
Google search: the keywords bringing in the most high-value traffic
-
LinkedIn: the ads that convert best based on engagement and view-through conversion metrics
-
Partners: the reps or customer success teams within each partner that refer the most deals
Not every source needs this layer. If you've already broken events down by individual event, you may not need to go further.
Step 3: Run a split funnel analysis
Knowing where pipeline is created is only half the picture. You also need to know how well each source converts.
A split funnel analysis breaks your pipeline down by source, showing how much each one creates and how much of that converts. You can segment it further by country or industry.
Say one source generates 70% of your pipeline but converts at 10%, while another generates just 10% of your pipeline but converts at 90%.
The smaller source could be the more valuable of the two, so the priority becomes finding ways to grow it. In many businesses, the high-volume, low-conversion source turns out to be events, which tend to need significant investment.
Track your leading indicators
Pipeline is a lagging metric. You need early signals that show whether you're on track before the quarter ends, such as:
-
Demo requests
-
Increases in branded search
-
Engagement from target accounts
Map leading indicators to each layer of your pipeline sources. Then build views that show whether you're likely to be on or off track in a few months' time.
Every business has stronger and weaker months, and very few enjoy consistent hockey stick growth. Leading indicators give you time to adjust before a weak month affects the whole quarter.
Step 4: Focus on 1 to 3 channels
Once you know where your best pipeline comes from, you can decide which channels deserve investment. Start with one to three channels where you have evidence that they work, scale, and deliver consistently.
A common reason pipeline stays unpredictable is that teams change tactics every month when they don't see immediate results. Waiting "a couple of months" sounds reasonable, but it's an assumption rather than a data-backed decision.
Match your test window to your sales cycle
Your test window should reflect how your market buys. If buyers spend four weeks researching before shortlisting vendors, and your sales cycle runs for six, 12, or 18 months, a one or two-month test won't tell you much.
Rule of thumb: your test window should cover at least one full sales cycle. A four-month sales cycle can't be fairly assessed with a four-week test.
No clear channels yet? Start with your buyers
If your pipeline comes from a wide spread of sources, start with buyer research. Find out:
-
Where your buyers spend time
-
How they discover new vendors in your space
-
Which channels they use to research and buy
Then test from there.
Step 5: Set decision rules before you start
Decision rules prevent tactic hopping. Many marketing teams fall into the habit of chasing new tactics, or reacting to instinct and incomplete early data.
A decision rule defines in advance what triggers scaling a channel and what triggers stopping it. For example:
-
If this channel generates four deals within two sales cycles, we'll increase investment by 50%.
-
If it doesn't, we'll stop and reallocate the budget.
The specific numbers matter less than tying the rule to a metric that's meaningful to your business. You could also base it on a pipeline stage, such as deals reaching a stage that converts at 50% or more within a set period.
Rules like these mean decisions are based on data rather than emotion. It's never easy to accept that an idea you believed in hasn't worked, but it's far better to know early than to keep investing in it.
Step 6: Spread your risk
Once one or two channels consistently produce a known amount of pipeline, you have your predictable sources. The next step is to protect them.
If one channel supplies most of your pipeline, a single change could lead to a difficult quarter. That could be:
-
An algorithm update
-
A partner relationship ending
-
A key rep leaving
Once you have a repeatable set of sources, expand into new channels. The aim is predictability across three or four channels rather than reliance on one or two.
What you can do this week
You don't need perfect data to get started. Spend an hour reviewing your current pipeline by source. If sources aren't tracked, ask your reps where each deal originated and build a manual view.
You'll usually find useful insights into where your best deals come from. That gives you a starting point for creating more of them, and a baseline to measure progress against.
Building a pipeline you can rely on
Predictable pipeline comes down to a number, a range, and a track record. Getting there requires clean CRM data, a layered view of your sources, a split funnel analysis, a focused set of channels, and decision rules set in advance.
It takes patience and rigour. But once you can hit your pipeline number consistently, you can invest in the right areas, plan with confidence, and build a business that's easier to grow and invest in.
Looking to build a more predictable pipeline? Speak with our team to discuss how we can help you create pipeline you can forecast with confidence.